Finding formants

Formant synthesis makes speech from formant tracks. This page runs the other way: linear prediction finds the formants of a sound, first of synthesized vowels whose formants are known, then of the two recorded talkers, whose tracks then drive the synthesizer.

Press play and a line follows the sound across every time axis in its plots. Click any time axis to play from that point. Start with your volume low.

To run this page yourself, open it as a notebook in Colab or download it. It is the same code, and it fetches the recordings it needs from the sonore repository.

Code the examples share

All the sounds are at 16 kHz. Each one is drawn as a waveform and a wideband spectrogram (Hann 6 ms), as on Formant synthesis, whose vowels are synthesized again here: the vowel of "hod" and Peterson and Barney's averages.

Setup, the same on every page
import os
import urllib.request

import matplotlib.pyplot as plt
import numpy as np

import sonore as so

plt.rcParams.update({"font.size": 9, "axes.titlesize": 10, "figure.dpi": 100})


def fetch(path):
    """A file from the sonore repository, by its path there: the local copy when this runs from
    the repository root, otherwise downloaded from GitHub to the same relative path."""
    if not os.path.exists(path):
        os.makedirs(os.path.dirname(path) or ".", exist_ok=True)
        urllib.request.urlretrieve("https://raw.githubusercontent.com/choyun1/sonore/main/" + path, path)
    return path


def finish(snd):
    """How every sound in the gallery is played: 5 ms ramps, RMS 0.1, peak at most 0.95."""
    snd = snd.ramp(5e-3).normalize(rms=0.1)
    return snd.normalize(peak=0.95) if snd.peak > 0.95 else snd
Code
FS = 16000


def onoff(dur, level=60, on=0.02, off=0.05):
    """An amplitude track: up over `on` seconds, down over the last `off` seconds."""
    return ([0, on, dur - off, dur], [0, level, level, 0])


def draw(container, snd, title, formants=(), long_titles=True):
    """Waveform and wideband spectrogram in a figure or subfigure, with formant tracks ((times,
    values) or numbers) drawn over it. Returns the two panels, for the playhead."""
    ax0, ax1 = container.subplots(2, 1, sharex=True, height_ratios=[0.45, 1])
    snd.plot(ax0, color="k", lw=0.4)
    ax0.set(title=title if not long_titles else f"Waveform: {title}", xlabel="")
    frame = so.GaborFrame(0.006, 0.001, n_fft=512)  # zero-padded for smooth bands
    so.STFT(snd, frame=frame).plot(ax1, db_range=60, colorbar=False, fmax=5000)
    if long_titles:
        ax1.set_title("Spectrogram (Hann 6 ms), with the formant frequencies given to the synthesizer")
    else:
        ax1.set_title("Spectrogram (Hann 6 ms), formants given dashed")
    for f in formants:
        t, v = ([0], [f]) if np.isscalar(f) else f  # a track is held after its last point
        ax1.plot([*t, snd.duration], np.array([*v, v[-1]]) / 1000, color="c", lw=1, ls="--")  # in kHz
    for ax in (ax0, ax1):
        ax.set_xlim(0, snd.duration)
    return [ax0, ax1]


def show(snd, title, formants=()):
    """One sound: waveform and wideband spectrogram, with its formants."""
    fig = plt.figure(figsize=(10, 4.2), layout="constrained")
    return fig, draw(fig, snd, title, formants)


# The vowel of "hod", its formants and bandwidths, as on Formant synthesis.
HOD = [(730, 60), (1090, 90), (2440, 150), (3500, 200), (4500, 250)]
hod = dict(F1=730, F2=1090, F3=2440)

VOWELS = {  # male averages, F1 F2 F3 (Hz)
    "heed": (270, 2290, 3010),
    "head": (530, 1840, 2480),
    "had": (660, 1720, 2410),
    "hod": (730, 1090, 2440),
    "hawed": (570, 840, 2410),
    "who'd": (300, 870, 2240),
}
VOWELS_FEMALE = {  # female averages
    "heed": (310, 2790, 3310),
    "head": (610, 2330, 2990),
    "had": (860, 2050, 2850),
    "hod": (850, 1220, 2810),
    "hawed": (590, 920, 2710),
    "who'd": (370, 950, 2670),
}
VOWEL_DUR = 0.42
GAP = 0.15
# Each set: its vowels, and what else it is made with (a falling pitch, and F4 and F5).
SETS = {
    "Male formants and pitch": (VOWELS, dict(F0=([0, VOWEL_DUR], [125, 105]), F4=3500, F5=4500)),
    "Female formants and pitch": (VOWELS_FEMALE, dict(F0=([0, VOWEL_DUR], [230, 200]), F4=4100, F5=4900)),
}

Linear prediction

A formant synthesizer runs one way: formants in, sound out. Linear prediction (LPC) runs the other way. It predicts each sample from the p before it,

x[n] \approx -\left(a_1 x[n-1] + \dots + a_p x[n-p]\right),

with the weights chosen to make the error as small as possible over a short time window. The predictor is a filter: the window is modeled as white noise through 1/A(z), with A(z) = 1 + a_1 z^{-1} + \dots + a_p z^{-p}. That is an all-pole filter like the cascade of resonators of Formant synthesis, and each pair of roots of A(z), at radius r and angle \theta, is a resonance at \theta f_s / 2\pi Hz, -\ln r \, f_s / \pi Hz wide: Klatt's resonator read backward (its poles sit at radius e^{-\pi B_k T} and angle 2\pi F_k T). so.LPC fits the predictor to every time window, and so.formant_track follows Praat's recipe for formants (resample to twice a ceiling, 5000 Hz for a male voice and 5500 Hz for a female one, fit ten poles, keep every root) and then links the roots of neighboring windows into F1, F2 and F3.

On a synthesized vowel the answer is known, so the estimate can be checked. The numbers below come from this page's sounds; docs/design/views/lpc.md measures them more widely.

Code
from scipy.signal import lfilter


def preemphasize(snd):
    """y[n] = x[n] - 0.97 x[n-1]: lifts the highs so the poles go to the formants, not the
    falling slope of the source."""
    return so.Sound(lfilter([1, -0.97], 1, snd.data, axis=0), snd.fs)


def peaks(freqs, level_db):
    """Frequencies of the local maxima of an envelope, refined by a parabola, 90 Hz to 5 kHz."""
    middle = level_db[1:-1]
    index = np.flatnonzero((middle > level_db[:-2]) & (middle >= level_db[2:])) + 1
    before, at, after = level_db[index - 1], level_db[index], level_db[index + 1]
    found = freqs[index] + 0.5 * (before - after) / (before - 2 * at + after) * (freqs[1] - freqs[0])
    return found[(found > 90) & (found < 5000)]

One vowel, four envelopes, and the formants LPC finds

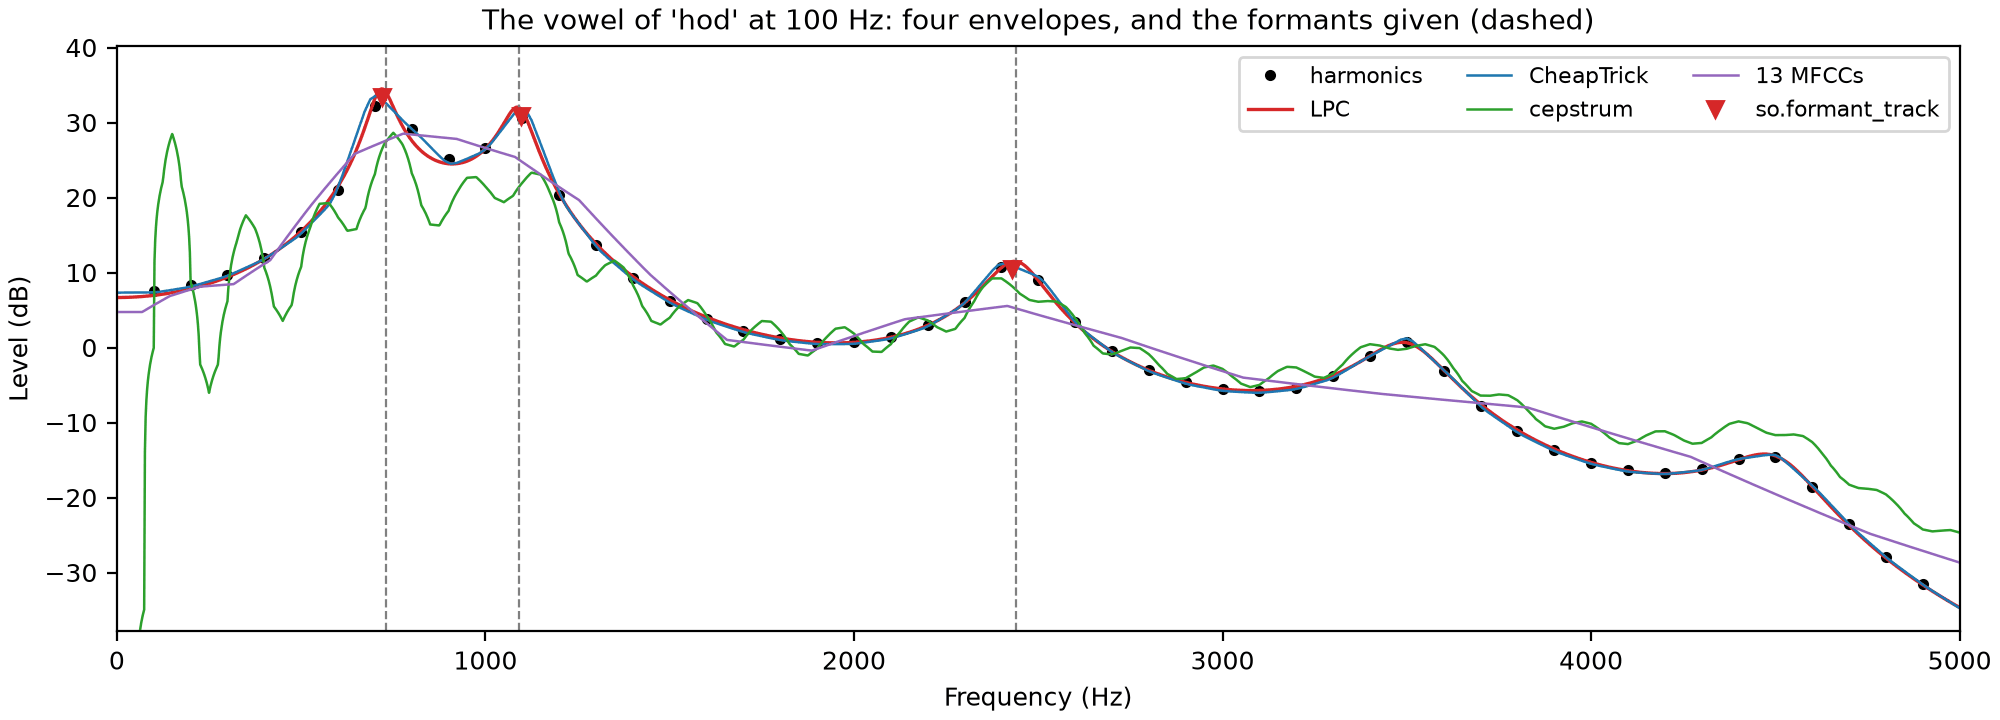
The vowel of "hod" at 100 Hz from so.klatt_synthesize, one time window in its middle. The dots are its harmonics; the dashed lines are the formants it was given. Four envelopes are drawn over them, each moved up or down to sit on the harmonics: LPC (order 18), CheapTrick, the cepstrum liftered at half a period, and thirteen MFCCs, all from the same pre-emphasized sound. LPC follows the peaks closely. Its roots are not all formants: with 18 poles at 16 kHz some fit the slope of the source or the harmonics instead, which is why so.formant_track fits ten poles below a 5000 Hz ceiling and then picks among them. The triangles are its F1 to F3, within a few hertz of the given formants (the cell prints them). The cepstral envelope keeps some ripple from the harmonics, so it has extra peaks below F1; thirteen MFCCs smooth F1 and F2 into one hump. MFCCs are not meant to find formants; the figure shows what each envelope keeps.
One vowel, four envelopes, and the formants LPC finds
Code
raw = so.klatt_synthesize(0.5, FS, F0=100, **hod)
vowel = preemphasize(raw)
time = 0.25
freqs = np.arange(0, 5001, 2.0)
envelopes = {}
lpc = so.LPC(vowel, win_dur=0.040, hop_dur=0.005)
column = int(np.argmin(np.abs(lpc.t - time)))
envelopes["LPC"] = lpc.envelope(freqs)[0, :, column]
envelopes["CheapTrick"] = so.cheaptrick(vowel, ([time], [100.0]))([time], freqs)[0, :, 0]
stft = so.STFT(vowel, win_dur=0.040, hop_dur=0.005)
cepstrum = so.Cepstrum(stft).lifter(0.5 / 100)
cep_freqs = np.arange(cepstrum.n_fft // 2 + 1) * FS / cepstrum.n_fft
envelopes["cepstrum"] = np.interp(freqs, cep_freqs, cepstrum.envelope()[0, :, column] ** 2)
mfcc = so.MFCC(vowel, triangles="area", hop_dur=0.005)
envelopes["13 MFCCs"] = mfcc.envelope(freqs)[0, :, int(np.argmin(np.abs(mfcc.t - time)))]

spectrum = np.abs(np.fft.rfft(vowel.data[FS // 4 - 320 : FS // 4 + 320, 0] * np.hanning(640), 8192)) ** 2
spectrum_freqs = np.fft.rfftfreq(8192, 1 / FS)
harmonic_freqs = np.arange(1, 50) * 100.0
harmonic_db = 10 * np.log10(np.interp(harmonic_freqs, spectrum_freqs, spectrum))

fig, ax = plt.subplots(figsize=(10, 3.6), layout="constrained")
ax.plot(harmonic_freqs, harmonic_db, "o", ms=3, color="k", label="harmonics")
for (name, envelope), color in zip(envelopes.items(), ["C3", "C0", "C2", "C4"], strict=True):
    level_db = 10 * np.log10(envelope)
    shift = np.mean(harmonic_db - np.interp(harmonic_freqs, freqs, level_db))
    ax.plot(freqs, level_db + shift, color=color, lw=1.2 if name == "LPC" else 0.9, label=name)
    found = peaks(freqs, level_db)[:3]
    print(f"{name:10} first three peaks: " + ", ".join(f"{f:.0f}" for f in found) + " Hz")
roots, _ = lpc.candidates()
print("Order-18 LPC roots: " + ", ".join(f"{f:.0f}" for f in roots[0, :, column] if f < 5000) + " Hz")
track = so.formant_track(raw)  # pre-emphasizes inside, as Praat does
lpc_formants = track.frequencies[0][:, int(np.argmin(np.abs(track.t - time)))]
print("so.formant_track: " + ", ".join(f"{f:.0f}" for f in lpc_formants) + " Hz (given 730, 1090, 2440)")
for formant, _ in HOD[:3]:
    ax.axvline(formant, color="0.5", ls="--", lw=0.8)
ax.plot(
    lpc_formants,
    np.interp(lpc_formants, freqs, 10 * np.log10(envelopes["LPC"])) + 3,
    "v",
    color="C3",
    ms=6,
    label="so.formant_track",
)
ax.set(xlabel="Frequency (Hz)", ylabel="Level (dB)", xlim=(0, 5000))
ax.set_ylim(harmonic_db.max() - 70, harmonic_db.max() + 8)
ax.set_title("The vowel of 'hod' at 100 Hz: four envelopes, and the formants given (dashed)")
ax.legend(loc="upper right", fontsize=8, ncols=3)
Given and recovered formants, male and female

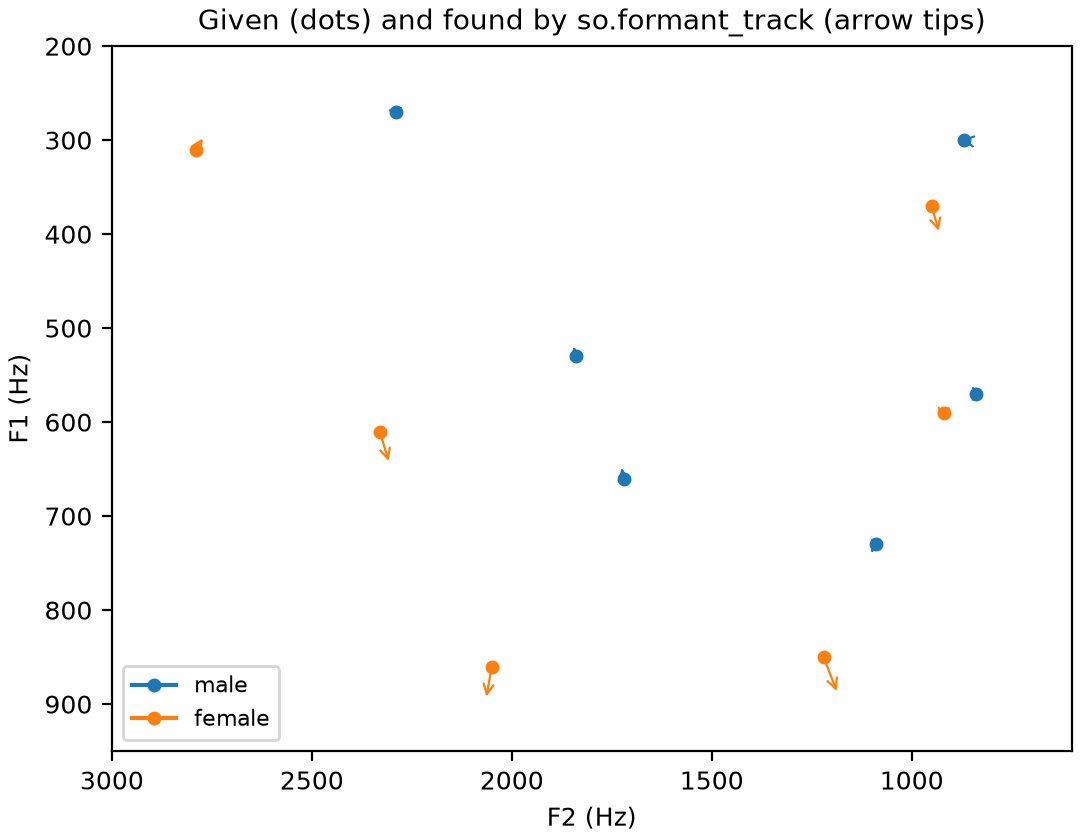
The twelve vowels of Six vowels, each run through so.formant_track (ceiling 5000 Hz for the male set, 5500 Hz for the female one) and averaged over its middle. Each arrow goes from the formants given to the formants found. The male vowels come back within a few percent; the female ones less closely, because with the pitch twice as high the harmonics sample the envelope half as often, and LPC is pulled toward the harmonics nearest a formant. The cell prints the largest errors.

Given and recovered formants, male and female
Code
fig, ax = plt.subplots(figsize=(5.4, 4.2), layout="constrained")
for (label, (vowels, rest)), color, ceiling in zip(SETS.items(), ["C0", "C1"], [5000, 5500], strict=True):
    errors = []
    for f1, f2, f3 in vowels.values():
        snd = so.klatt_synthesize(
            0.5, FS, F0=rest["F0"][1][0], F1=f1, F2=f2, F3=f3, F4=rest["F4"], F5=rest["F5"]
        )
        track = so.formant_track(snd, ceiling=ceiling)
        middle = (track.t > 0.1) & (track.t < 0.4)
        found = np.median(track.frequencies[0][:, middle], axis=1)
        errors.append(np.abs(found - (f1, f2, f3)) / (f1, f2, f3))
        ax.annotate("", (found[1], found[0]), (f2, f1), arrowprops=dict(arrowstyle="->", color=color, lw=0.8))
        ax.plot(f2, f1, "o", color=color, ms=4)
    errors = np.array(errors)
    print(
        f"{label.split()[0]}: largest error {100 * errors.max():.1f}%, median {100 * np.median(errors):.1f}%"
    )
    ax.plot([], [], "o-", color=color, ms=4, label=label.split()[0].lower())
ax.set(xlabel="F2 (Hz)", ylabel="F1 (Hz)", xlim=(3000, 600), ylim=(950, 200))
ax.legend(loc="lower left", fontsize=8)
ax.set_title("Given (dots) and found by so.formant_track (arrow tips)")
Code
def draw_tracks(axes, track, voiced=None):
    """F1 to F3 from a FormantTrack over a spectrogram panel (in kHz), voiced time windows only."""
    keep = np.ones(len(track.t), bool) if voiced is None else voiced
    for number in range(3):
        axes.plot(track.t, np.where(keep, track.frequencies[0, number], np.nan) / 1000, color="w", lw=1.4)
        axes.plot(track.t, np.where(keep, track.frequencies[0, number], np.nan) / 1000, color="C3", lw=0.8)

The estimate as the pitch rises

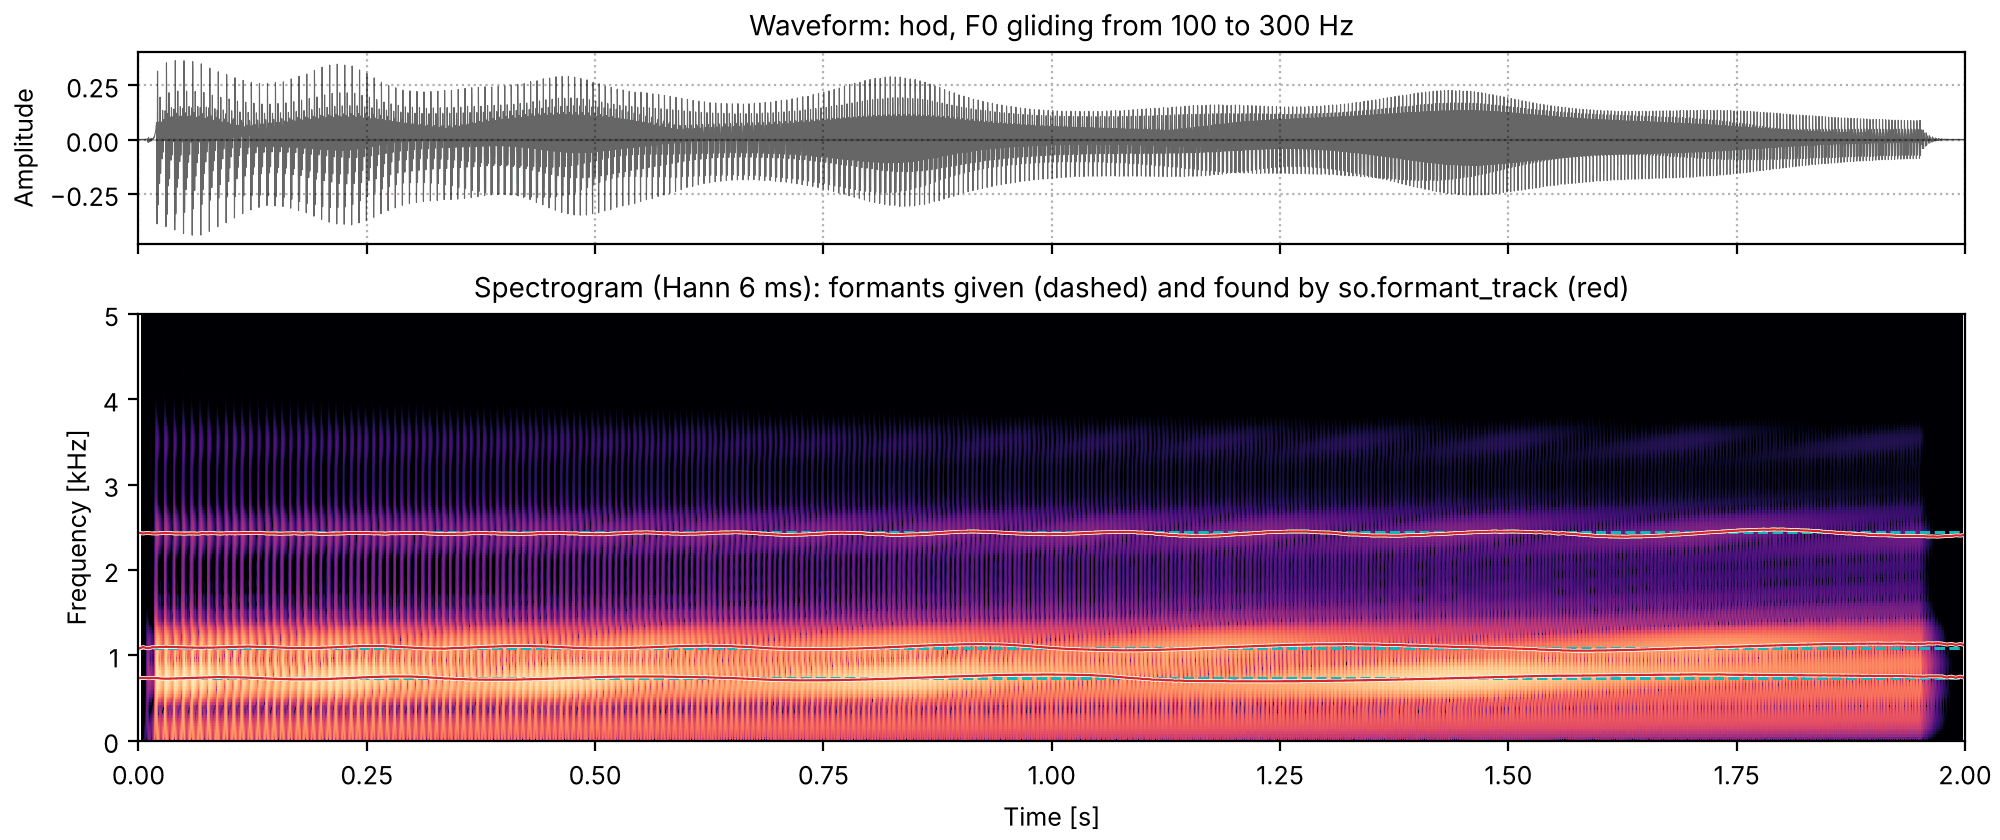
The vowel of "hod" with the pitch gliding from 100 to 300 Hz. The dashed lines are the formants it was given, the red ones what so.formant_track finds. The error grows with the pitch: the cell prints its median over each quarter of the glide, about 10 Hz at the bottom and 30 Hz at the top, with single windows off by up to 50 Hz. This is the main limit of LPC for formants: it fits the harmonics, and with few of them under a formant it is pulled toward the harmonic nearest it.

ft3_the_estimate_as_the_pitch_rises.flac, 2.0 s, mono

Plots of the the estimate as the pitch rises sound
Code
dur = 2.0
glide = so.klatt_synthesize(dur, FS, F0=([0, dur], [100, 300]), AV=onoff(dur), **hod)
track = so.formant_track(glide)
pitch_at = 100 + 200 * track.t / dur
for low in (100, 150, 200, 250):
    inside = (pitch_at >= low) & (pitch_at < low + 50) & (track.t > 0.05) & (track.t < dur - 0.05)
    error = np.median(np.abs(track.frequencies[0][:, inside] - np.array([[730], [1090], [2440]])), axis=1)
    print(
        f"F0 {low}-{low + 50} Hz: median error of F1, F2, F3 " + ", ".join(f"{e:.0f}" for e in error) + " Hz"
    )
sound = finish(glide)
fig, playhead = show(sound, "hod, F0 gliding from 100 to 300 Hz", [730, 1090, 2440])
draw_tracks(playhead[1], track)
playhead[1].set_title("Spectrogram (Hann 6 ms): formants given (dashed) and found by so.formant_track (red)")

A recording

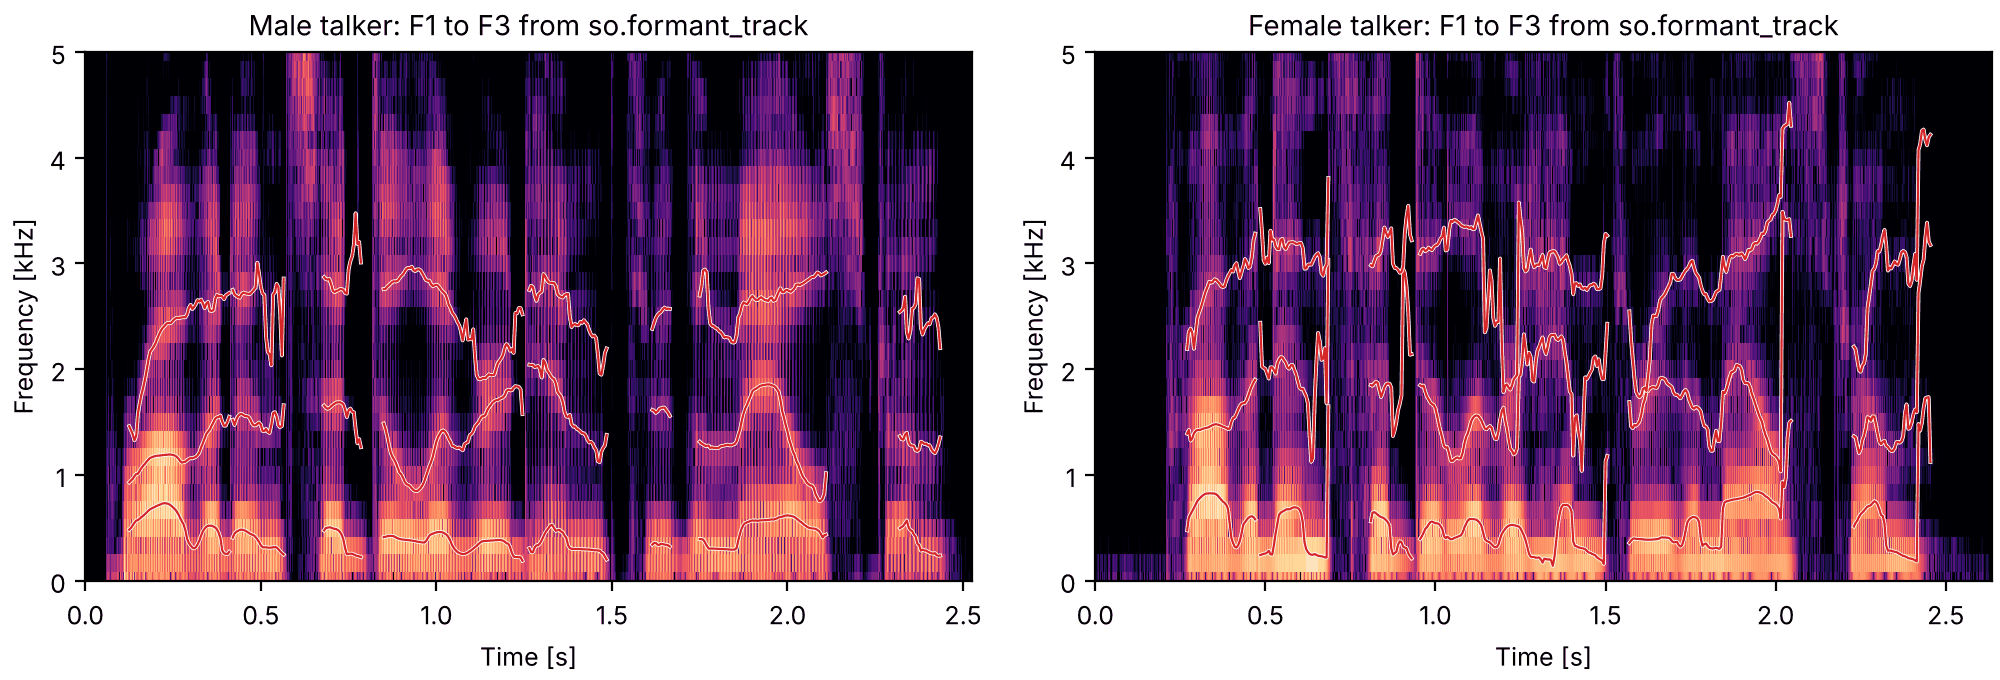
The same analysis on the two talkers the other pages use, saying "Author of the danger trail, Philip Steels, etc." (CMU ARCTIC; sources in docs/speech/SOURCES.md). Formants are only meaningful where the voice is voiced, so so.f0_track decides where to draw them. There is no answer to check against here, only Praat: the tracks agree with Praat's own formants to a few hertz in the median (the tests check a stretch of each sentence).

Code
SPEAKERS = {"Male talker": ("bdl", 5000), "Female talker": ("slt", 5500)}
talkers, formant_tracks, voicing, pitch = {}, {}, {}, {}
for label, (speaker, ceiling) in SPEAKERS.items():
    talkers[label] = so.load(fetch(f"docs/speech/{speaker}_arctic_a0131.flac"))
    formant_tracks[label] = so.formant_track(talkers[label], ceiling=ceiling)
    pitch[label] = so.f0_track(talkers[label])
    on_grid = np.interp(formant_tracks[label].t, pitch[label].t, pitch[label].voiced[0].astype(float))
    voicing[label] = on_grid > 0.5

Formant tracks of two talkers

Both sentences, with F1 to F3 drawn where the voice is voiced. The female talker's formants are higher, and the tracks are less steady: with the harmonics farther apart there is less envelope for LPC to fit, as in the glide above.

Male talker

ft4_formant_tracks_of_two_talkers_male_talker.flac, 2.5 s, mono

Female talker

ft4_formant_tracks_of_two_talkers_female_talker.flac, 2.6 s, mono

Plots of the formant tracks of two talkers sounds
Code
fig = plt.figure(figsize=(10, 3.4), layout="constrained")
playhead = {}
for column, (label, snd) in zip(fig.subfigures(1, 2), talkers.items(), strict=True):
    ax = column.subplots()
    so.STFT(snd, win_dur=0.006, hop_dur=0.001).plot(ax, db_range=60, colorbar=False, fmax=5000)
    draw_tracks(ax, formant_tracks[label], voicing[label])
    ax.set(xlim=(0, snd.duration), title=f"{label}: F1 to F3 from so.formant_track")
    playhead[label] = [ax]
sounds = {label: finish(snd) for label, snd in talkers.items()}

Copy synthesis

With formant tracks and a pitch track, the synthesizer can be driven from a recording rather than by hand. Here so.klatt_synthesize gets, every 5 ms, the measured F1 to F3 (with a five-window median to take out single-window jumps), the measured F_0 while voiced, a voicing level that follows the recording's level, and, where the voice is unvoiced, aspiration noise at that level through the same tracked formants (none where the recording is more than 35 dB below its loudest). F4 and F5, the bandwidths and the source are the synthesizer's defaults. This is a crude copy: it keeps the formants, the pitch and the level, and drops everything else, including the shape of the fricatives and bursts, which go through the formants as breath noise.

Code
from scipy.ndimage import median_filter


def copy_synthesis(snd, track, f0_track, voiced):
    """Klatt parameters from measured tracks: F1-F3 (median of 5 windows), F0 where voiced, AV
    following the level in dB where voiced, AH at that level where unvoiced and not silent."""
    times = track.t
    inside = (times >= 0) & (times <= snd.duration)
    times, voiced = times[inside], voiced[inside]
    formants = median_filter(np.nan_to_num(track.frequencies[0][:, inside], nan=1000.0), size=(1, 5))
    samples, window = snd.data[:, 0], round(0.025 * snd.fs)
    starts = np.clip(np.round(times * snd.fs).astype(int) - window // 2, 0, len(samples) - window)
    level = np.array([np.sqrt(np.mean(samples[s : s + window] ** 2)) for s in starts]) + 1e-12
    level_db = 20 * np.log10(level / level.max())
    f0 = np.interp(times, f0_track.t, np.where(f0_track.voiced[0], f0_track.f0[0], 0.0))
    return so.klatt_synthesize(
        snd.duration,
        snd.fs,
        F0=(times, np.where(voiced, f0, 0.0)),
        AV=(times, np.where(voiced, np.maximum(60 + level_db, 0), 0)),
        AH=(times, np.where(voiced | (level_db < -35), 0, 55 + level_db)),
        F1=(times, formants[0]),
        F2=(times, formants[1]),
        F3=(times, formants[2]),
        rng=0,
    )


copies = {
    label: copy_synthesis(snd, formant_tracks[label], pitch[label], voicing[label])
    for label, snd in talkers.items()
}

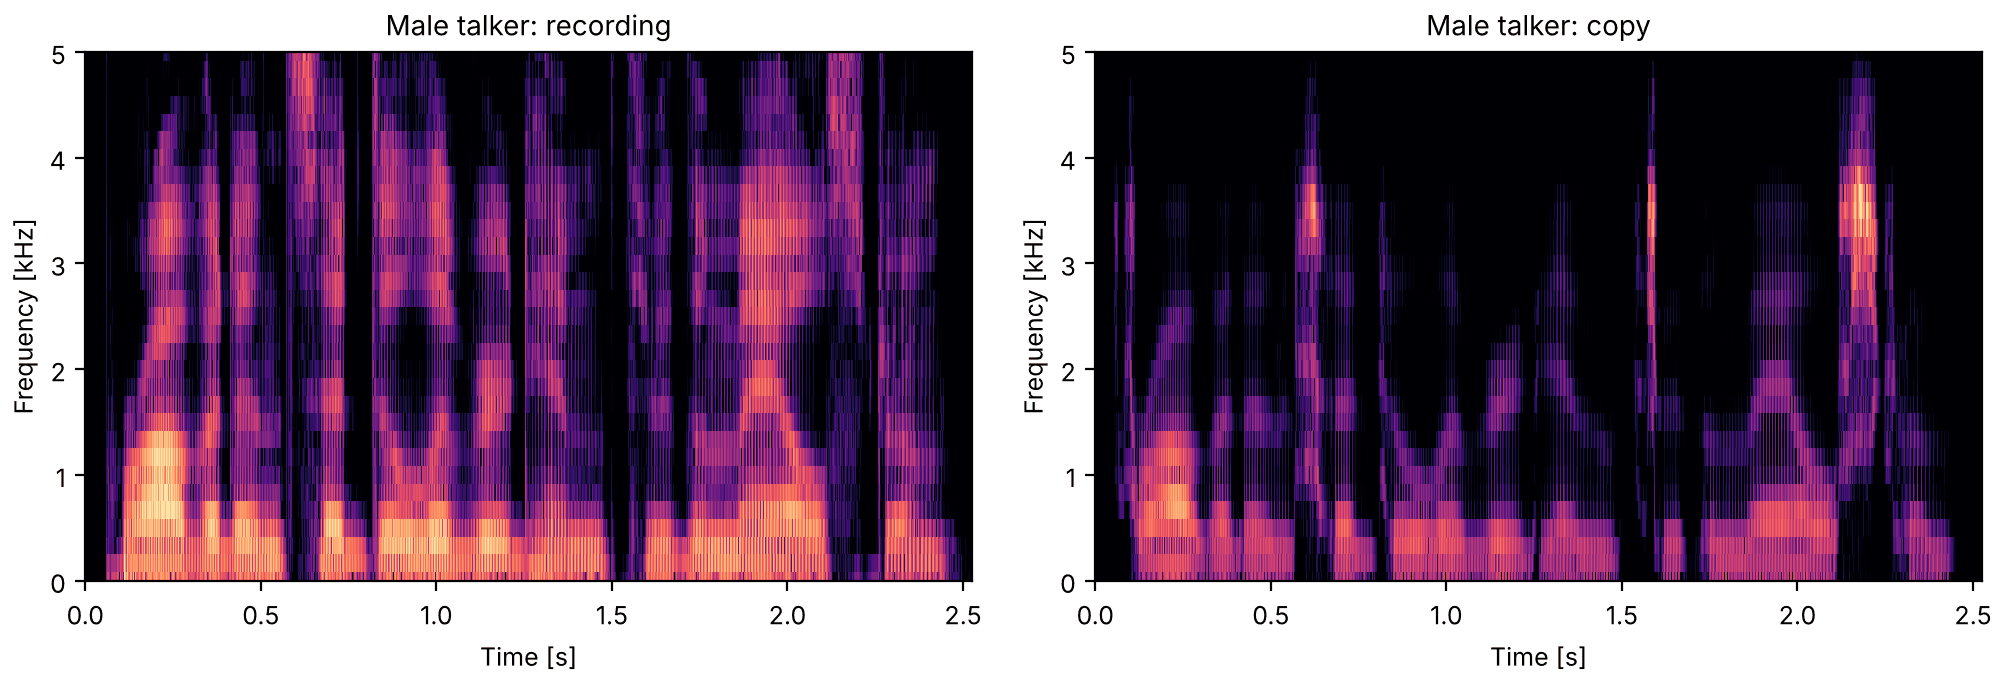
The male talker and the copy

The male talker: the recording, then the copy. The formant movements and the melody carry over; the voice quality, the consonants and the higher formants do not. The copy is also darker above 1 kHz, most likely because the synthesizer's default source falls off faster than this talker's voice. How intelligible the copy is has not been measured.

Recording

ft5_the_male_talker_and_the_copy_recording.flac, 2.5 s, mono

Copy

ft5_the_male_talker_and_the_copy_copy.flac, 2.5 s, mono

Plots of the the male talker and the copy sounds
Code
fig = plt.figure(figsize=(10, 3.4), layout="constrained")
playhead = {}
pair = {"Recording": talkers["Male talker"], "Copy": copies["Male talker"]}
for column, (label, snd) in zip(fig.subfigures(1, 2), pair.items(), strict=True):
    ax = column.subplots()
    so.STFT(snd, win_dur=0.006, hop_dur=0.001).plot(ax, db_range=60, colorbar=False, fmax=5000)
    ax.set(xlim=(0, snd.duration), title=f"Male talker: {label.lower()}")
    playhead[label] = [ax]
sounds = {label: finish(snd) for label, snd in pair.items()}

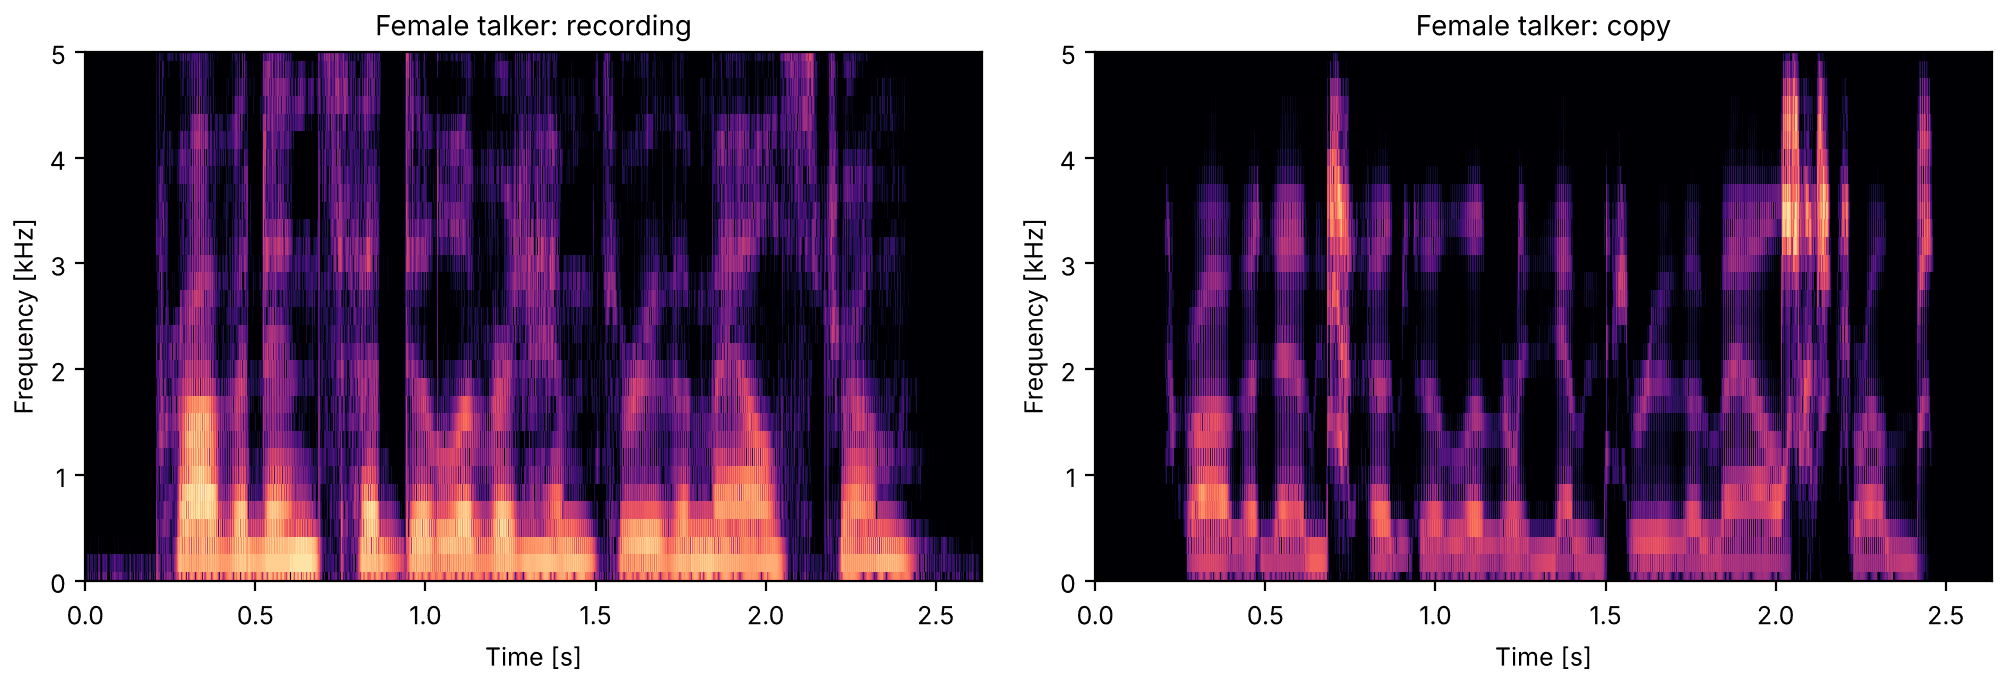
The female talker and the copy

The female talker and the copy, made the same way.

Recording

ft6_the_female_talker_and_the_copy_recording.flac, 2.6 s, mono

Copy

ft6_the_female_talker_and_the_copy_copy.flac, 2.6 s, mono

Plots of the the female talker and the copy sounds
Code
fig = plt.figure(figsize=(10, 3.4), layout="constrained")
playhead = {}
pair = {"Recording": talkers["Female talker"], "Copy": copies["Female talker"]}
for column, (label, snd) in zip(fig.subfigures(1, 2), pair.items(), strict=True):
    ax = column.subplots()
    so.STFT(snd, win_dur=0.006, hop_dur=0.001).plot(ax, db_range=60, colorbar=False, fmax=5000)
    ax.set(xlim=(0, snd.duration), title=f"Female talker: {label.lower()}")
    playhead[label] = [ax]
sounds = {label: finish(snd) for label, snd in pair.items()}

What this page leaves out

  • A better copy. Copy synthesis above keeps three formants, the pitch and the level. A fuller copy would also fit F4, the bandwidths, the voicing source and the parallel branch for the consonants. Rebuilding and changing a voice rebuilds a recording from its measured pitch and whole envelope instead, which keeps far more of it.

References

  • Klatt (1980). Software for a cascade/parallel formant synthesizer. J. Acoust. Soc. Am. 67(3), 971–995. doi:10.1121/1.383940. klatt.klatt_synthesize
  • Makhoul (1975). Linear prediction: A tutorial review. Proc. IEEE 63(4), 561–580. doi:10.1109/PROC.1975.9792. lpc.LPC
  • Boersma & Weenink. Praat: doing phonetics by computer (computer program). praat.org. Its formant recipe, which so.formant_track follows. lpc.formant_track
  • Peterson & Barney (1952). Control methods used in a study of the vowels. J. Acoust. Soc. Am. 24(2), 175–184. ASA. The vowels' formant frequencies.