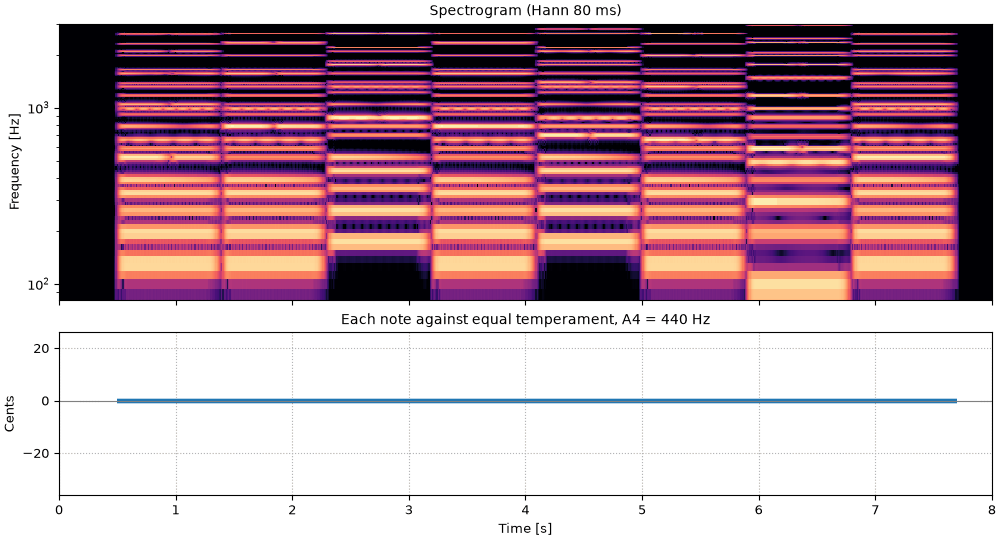
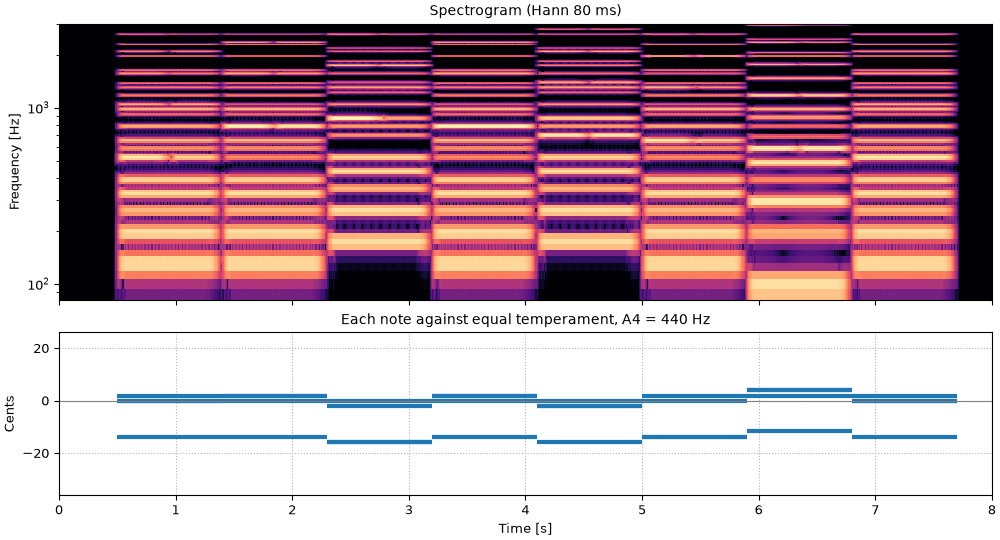
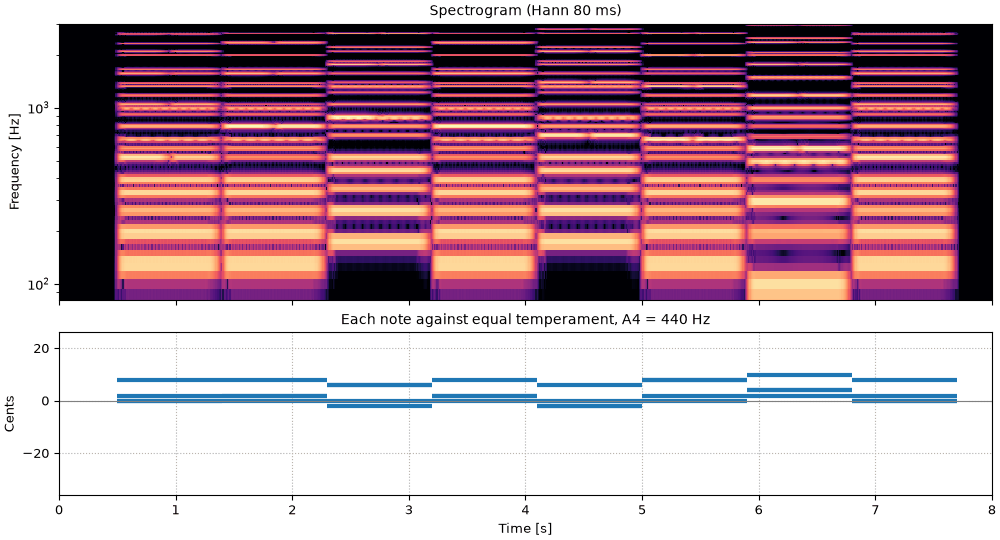
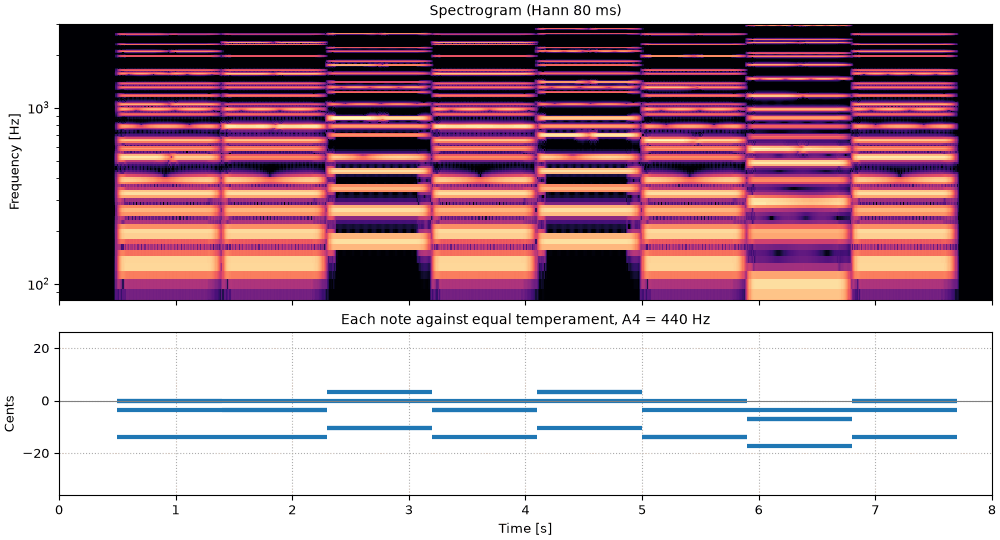
Code
import matplotlib.pyplot as plt
import numpy as np

import sonore as so
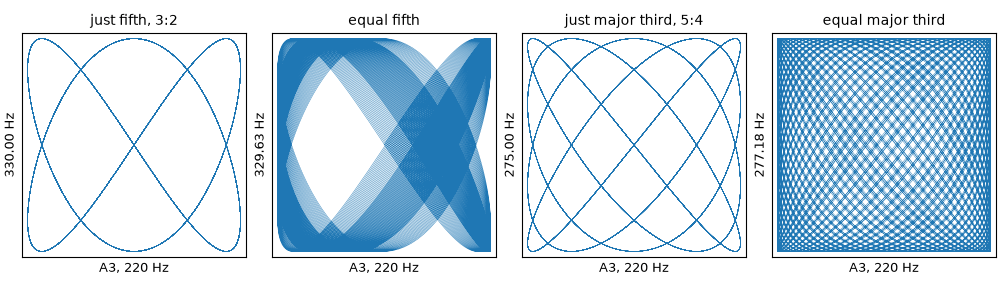
from sonore.plotting import plot_lissajous

plt.rcParams.update({"font.size": 9, "axes.titlesize": 10, "figure.dpi": 100})
FS = 22050
C4 = so.note_to_freq("C4")
LEAD = 0.5  # silence before every sound [s]
PARTIALS = np.arange(1, 9)

# The seven notes of C major as frequency ratios to C, in four tunings. Quarter-comma meantone
# narrows every fifth by a quarter of the syntonic comma, so that four fifths make a just
# major third: its fifth is the fourth root of 5.
MEANTONE_FIFTH = 5**0.25
TUNINGS = {
    "equal temperament": {
        name: 2 ** (steps / 12) for name, steps in zip("CDEFGAB", (0, 2, 4, 5, 7, 9, 11), strict=True)
    },
    "just intonation": {"C": 1, "D": 9 / 8, "E": 5 / 4, "F": 4 / 3, "G": 3 / 2, "A": 5 / 3, "B": 15 / 8},
    "Pythagorean": {"C": 1, "D": 9 / 8, "E": 81 / 64, "F": 4 / 3, "G": 3 / 2, "A": 27 / 16, "B": 243 / 128},
    "quarter-comma meantone": {
        "C": 1,
        "D": MEANTONE_FIFTH**2 / 2,
        "E": 5 / 4,
        "F": 2 / MEANTONE_FIFTH,
        "G": MEANTONE_FIFTH,
        "A": MEANTONE_FIFTH**3 / 2,
        "B": MEANTONE_FIFTH**5 / 4,
    },
}


def pitch(note, tuning, c4=C4):
    """Frequency of a note name such as "G4" in one of TUNINGS, with C4 at ``c4``."""
    return c4 * TUNINGS[tuning][note[0]] * 2.0 ** (int(note[1:]) - 4)


def tone(f0, duration, attack=60e-3, release=120e-3):
    """One note: eight harmonics falling as 1/n, fading in over ``attack`` and out over
    ``release`` seconds (raised-cosine ramps), so that notes start and stop softly."""
    note = so.harmonic_complex(duration, FS, f0, harmonics=PARTIALS, amplitudes=1 / PARTIALS, ramp=0)
    n_attack, n_release = int(attack * FS), int(release * FS)
    envelope = np.ones(note.n_samples)
    envelope[:n_attack] = 0.5 - 0.5 * np.cos(np.pi * np.arange(n_attack) / n_attack)
    envelope[note.n_samples - n_release :] = 0.5 + 0.5 * np.cos(np.pi * np.arange(n_release) / n_release)
    return note * envelope[:, None]


def finish(snd):
    """How every sound in the gallery is played: 5 ms ramps, RMS 0.1, peak at most 0.95."""
    snd = snd.ramp(5e-3).normalize(rms=0.1)
    return snd.normalize(peak=0.95) if snd.peak > 0.95 else snd


def play(events, total):
    """Mix ``events``, rows of (start [s], duration [s], frequency [Hz]), into one sound,
    after LEAD seconds of silence."""
    data = np.zeros(int(round((LEAD + total) * FS)))
    for start, duration, f0 in events:
        note = tone(f0, duration).data[:, 0]
        first = int(round((LEAD + start) * FS))
        data[first : first + len(note)] += note
    return so.Sound(data, FS)


def figure_notes(chords, label=None):
    """Lissajous rows (start, end, lowest, highest, label) for chords given as
    (start, duration, frequencies)."""
    rows = []
    for start, duration, freqs in chords:
        low, high = min(freqs), max(freqs)
        text = label(low, high) if label else f"{high / low:.3f} : 1"
        rows.append((LEAD + start, LEAD + start + duration, low, high, text))
    return rows


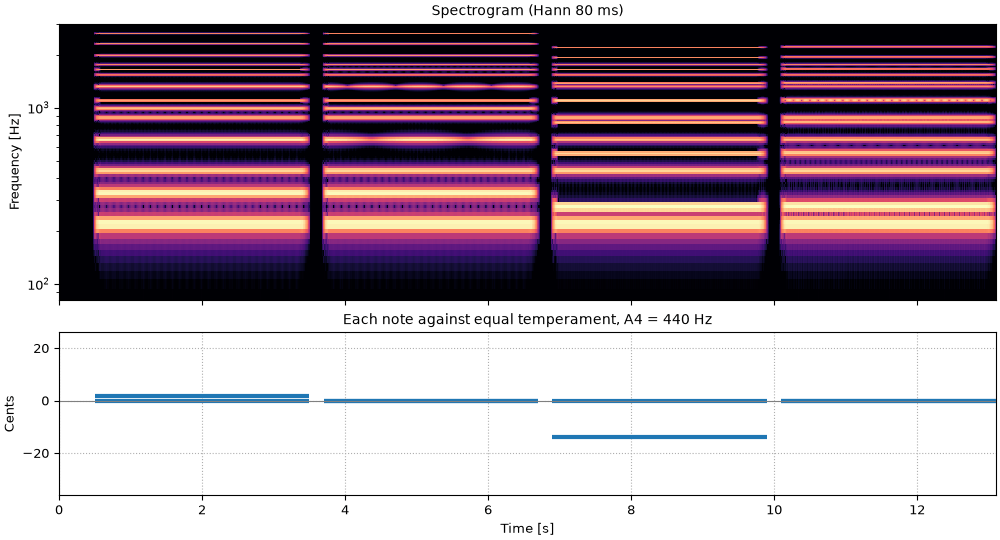
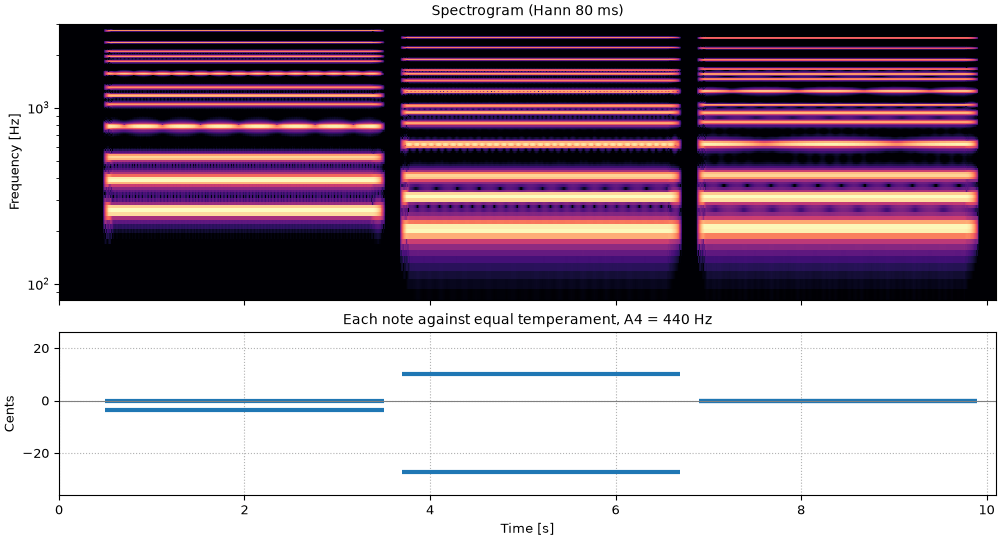
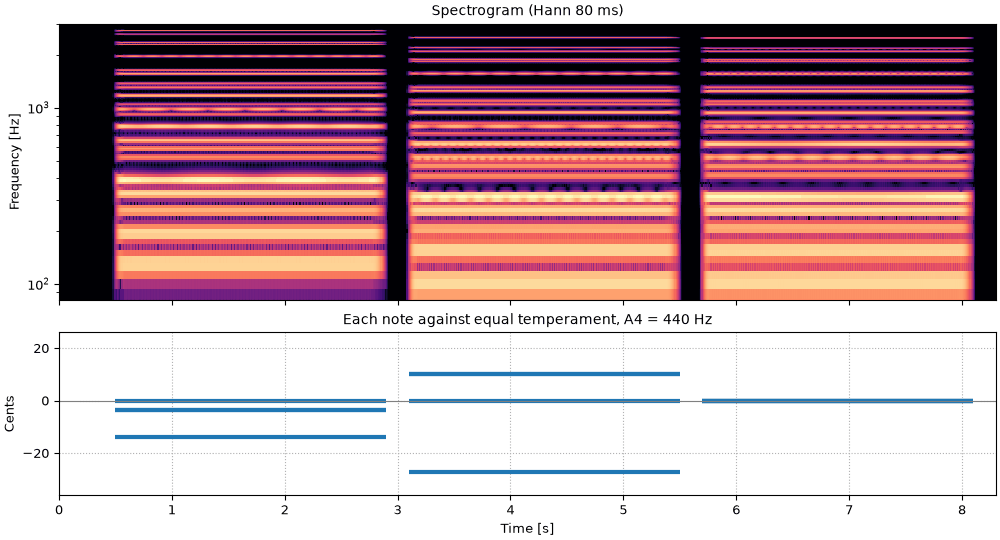
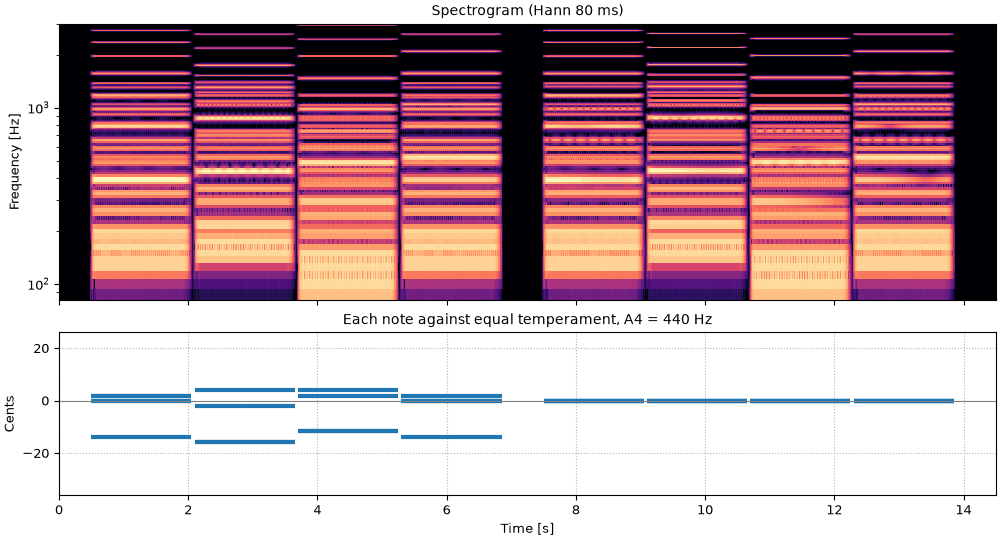
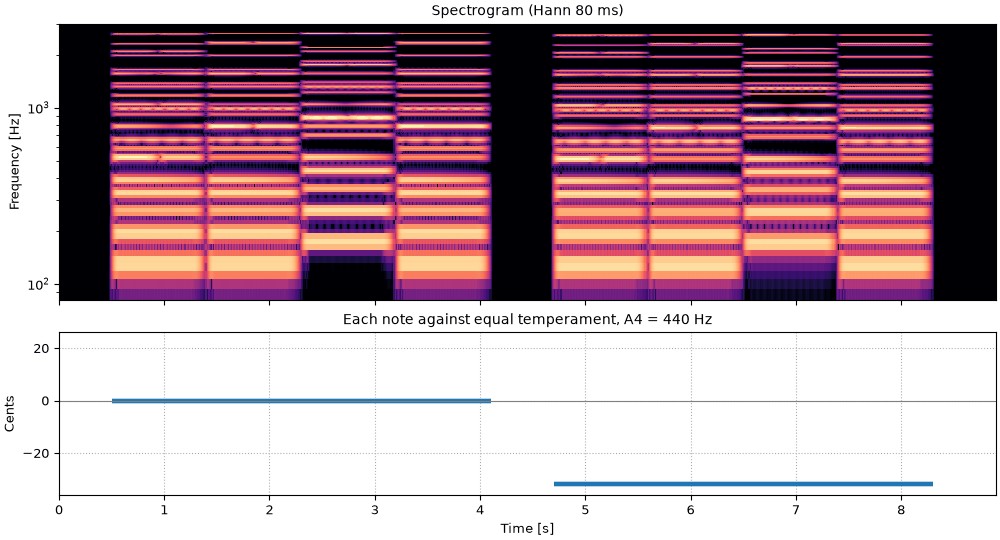
def show(snd, events, fmin=80, fmax=3000, reference=440.0):
    """Spectrogram on a log frequency axis, and each note's distance in cents from equal
    temperament at A4 = ``reference``. Returns the figure and the panels the playhead follows."""
    fig, (ax_s, ax_c) = plt.subplots(
        2, 1, figsize=(10, 5.4), sharex=True, height_ratios=[1.7, 1], layout="constrained"
    )
    stft = so.STFT(snd, 80e-3, 10e-3)
    keep = (stft.f >= fmin) & (stft.f <= fmax)
    level = stft.db[0][keep]
    ax_s.pcolormesh(stft.t, stft.f[keep], level, vmin=level.max() - 70, vmax=level.max(), cmap="magma")
    ax_s.set(yscale="log", ylabel="Frequency [Hz]", title="Spectrogram (Hann 80 ms)")
    for start, duration, f0 in events:
        steps = 12 * np.log2(f0 / reference) + 69  # MIDI note number, equal temperament at A4 = 440
        offset = 100 * (steps - np.round(steps))
        span = [LEAD + start, LEAD + start + duration]
        ax_c.plot(span, [offset, offset], lw=3, solid_capstyle="butt", color="C0")
    ax_c.axhline(0, color="0.5", lw=0.8)
    ax_c.set(
        xlim=(0, snd.duration),
        ylim=(-36, 26),
        xlabel="Time [s]",
        ylabel="Cents",
        title="Each note against equal temperament, A4 = 440 Hz",
    )
    ax_c.grid(ls=":")
    return fig, [ax_s, ax_c]