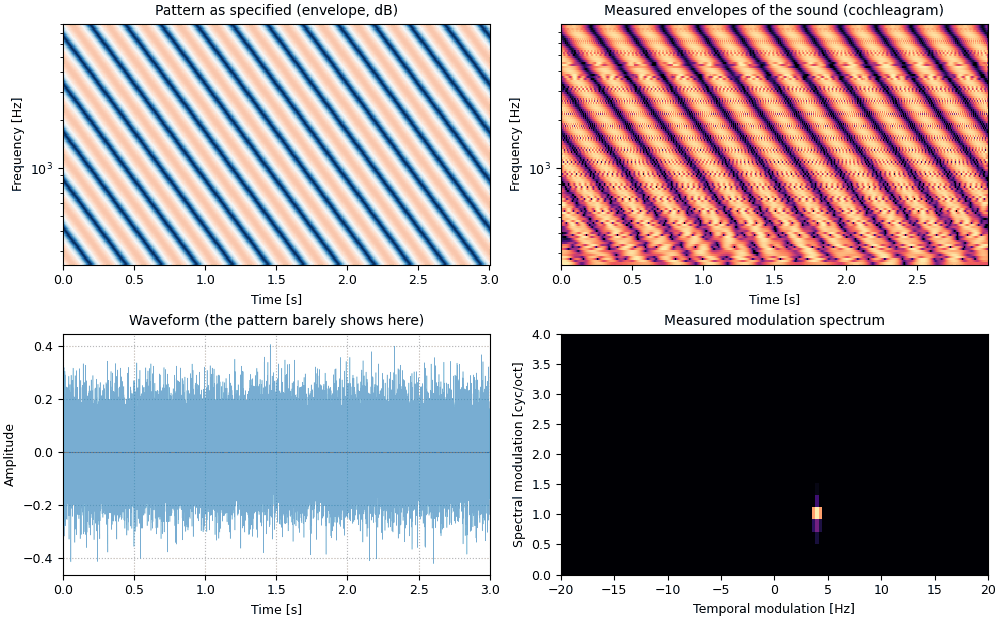
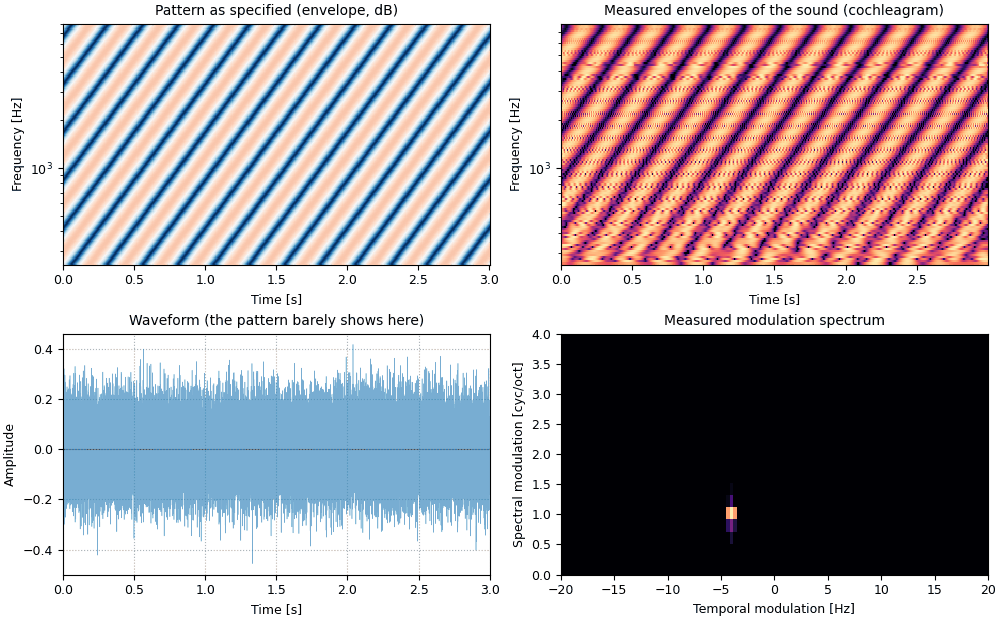
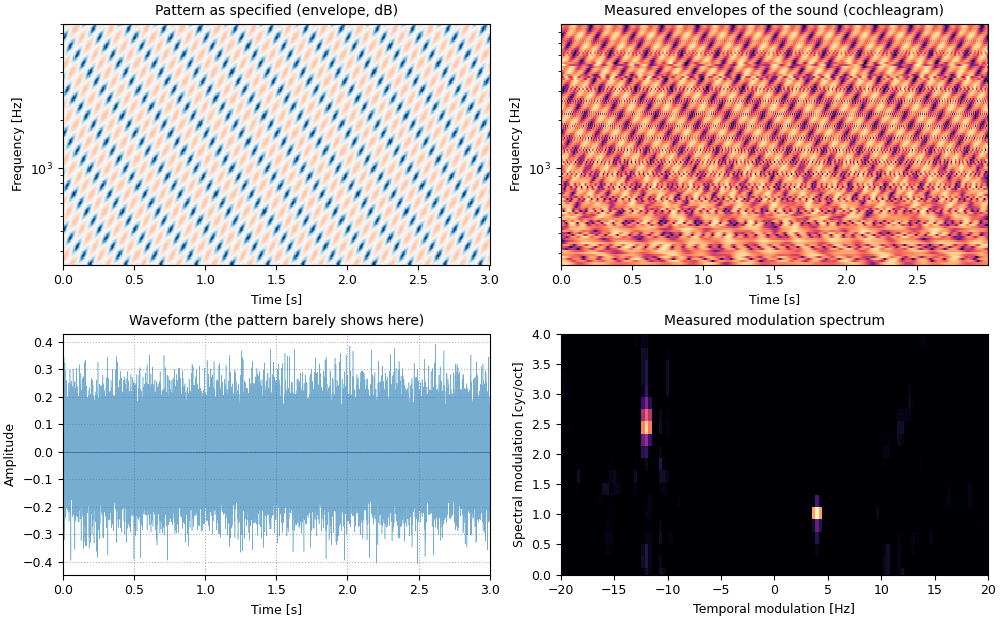
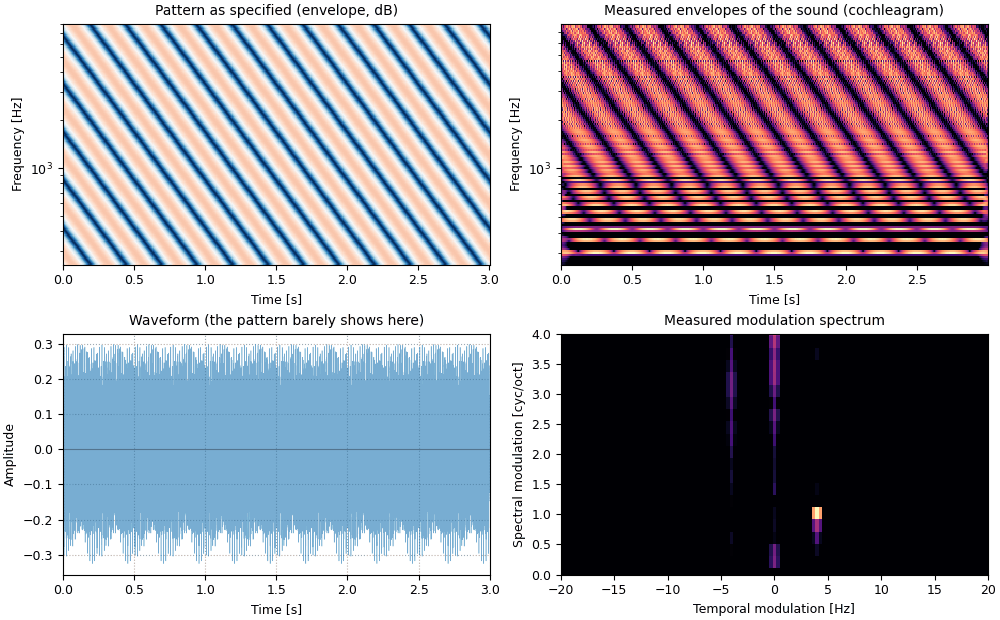
Code
import matplotlib.pyplot as plt

import sonore as so

plt.rcParams.update({"font.size": 9, "axes.titlesize": 10, "figure.dpi": 100})
FS = 44100


def finish(snd):
    """How every sound in the gallery is played: 5 ms ramps, RMS 0.1, peak at most 0.95."""
    snd = snd.ramp(5e-3).normalize(rms=0.1)
    return snd.normalize(peak=0.95) if snd.peak > 0.95 else snd


def show(snd, pattern, dmr=False):
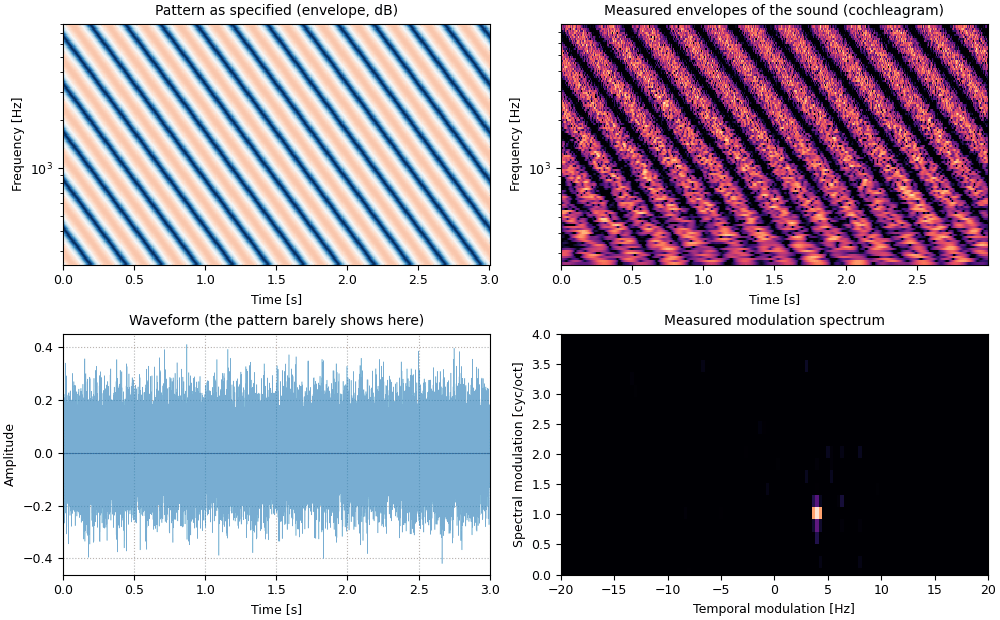
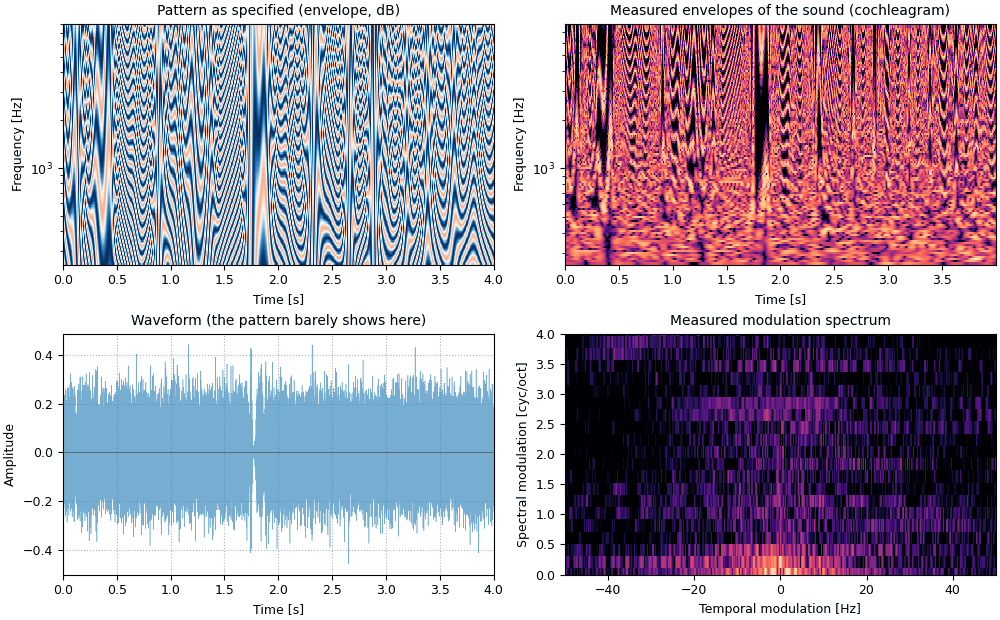
    """The pattern as specified, then the sound's cochleagram, waveform and modulation spectrum.
    Returns the figure and the panels the playhead follows."""
    fig, axes = plt.subplots(2, 2, figsize=(10, 6.2), layout="constrained")
    pattern.plot(duration=snd.duration, f_lo=250, f_hi=8000, ax=axes[0, 0], colorbar=False)
    axes[0, 0].set_title("Pattern as specified (envelope, dB)")
    bank = so.cosine_filterbank(f_lo=250, f_hi=8000, spacing=1 / 24, scale="octave")
    bank.analyze(snd).envelopes(lowpass=200, fs=1000).plot(axes[0, 1], db_range=30, colorbar=False)
    axes[0, 1].set_title("Measured envelopes of the sound (cochleagram)")
    snd.plot(axes[1, 0], lw=0.4)
    axes[1, 0].set_title("Waveform (the pattern barely shows here)")
    ms = so.ModulationSpectrum.octave(snd, f_lo=250, f_hi=8000, scale="db" if dmr else "linear")
    ms.plot(axes[1, 1], db_range=30, wt_max=50 if dmr else 20, wf_max=4, colorbar=False)
    axes[1, 1].set_title("Measured modulation spectrum")
    return fig, [axes[0, 0], axes[0, 1], axes[1, 0]]