Each bin reports its partial
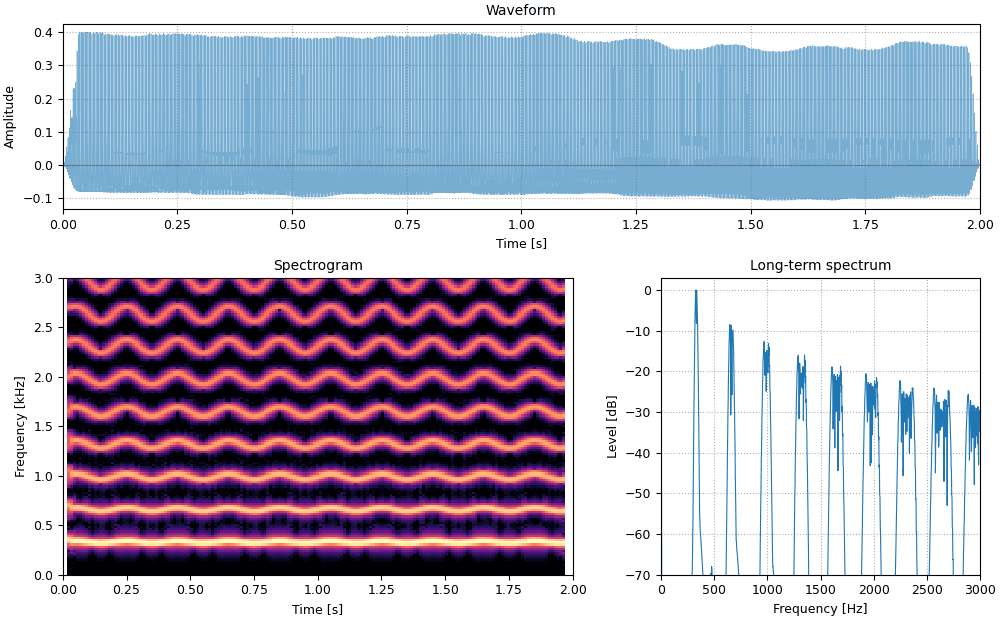
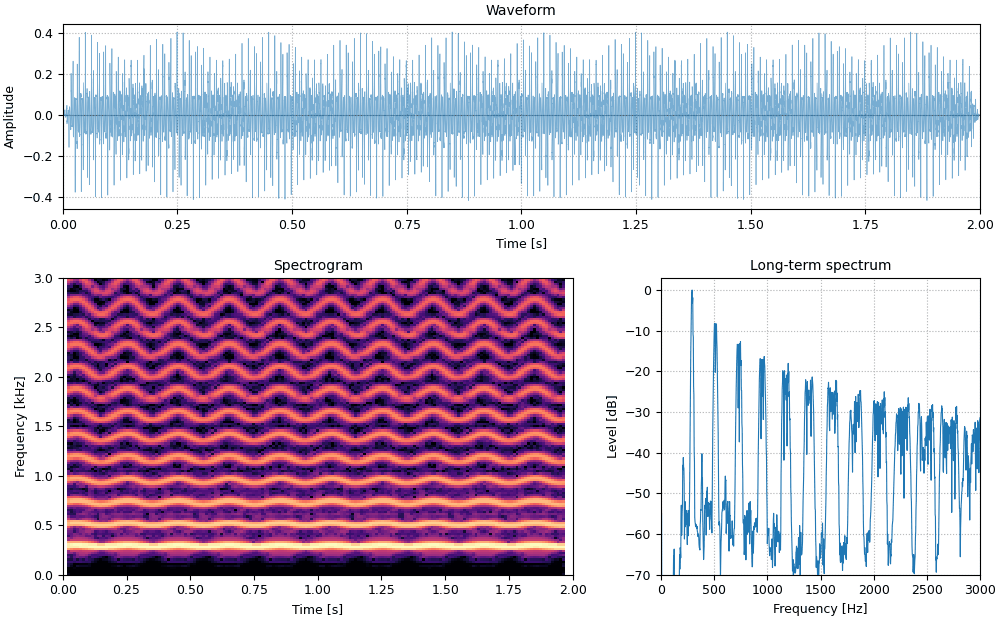
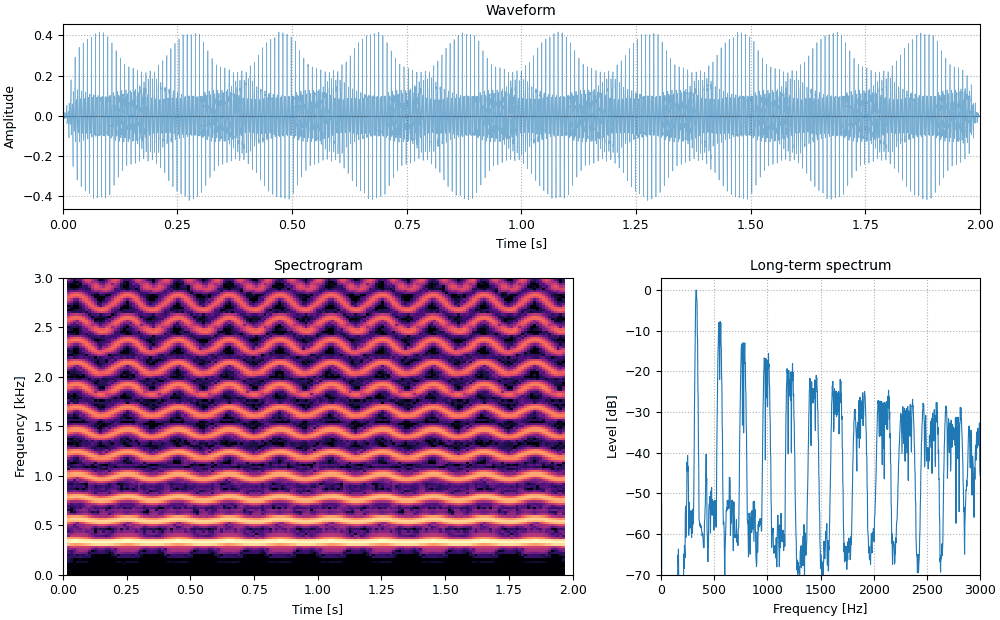
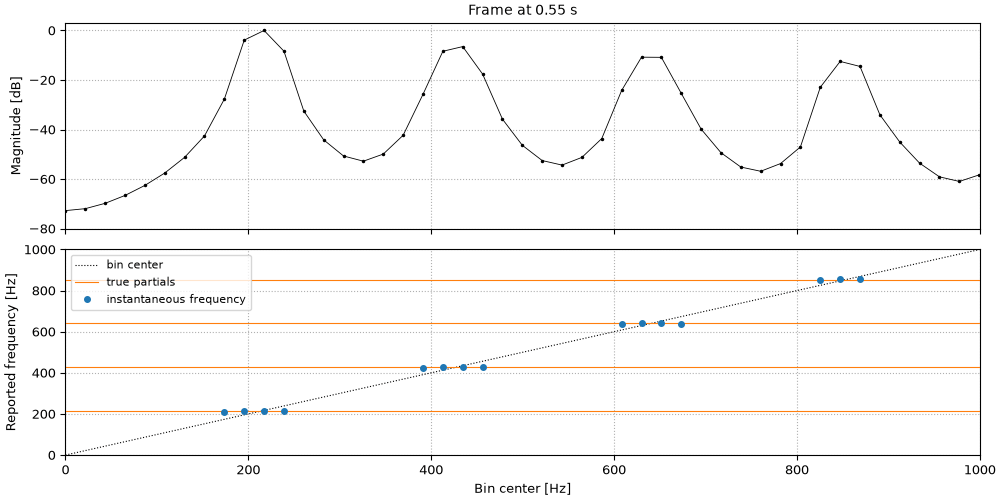
One time window of the reference tone below, 0 to 1 kHz. Top: the magnitude of each bin, with the partials' main lobes spanning several bins each. Bottom: the frequency each bin reports. Across each main lobe the estimates agree on one value, the partial's frequency at that moment (orange), which the vibrato has pushed away from the bin centers (dotted).
Code
m = int(np.argmin(np.abs(pv.t - 0.55)))
centers = np.arange(pv.magnitude.shape[1]) * FS / pv.n_win
level = 20 * np.log10(pv.magnitude[0, :, m] / pv.magnitude[0, :, m].max() + 1e-12)
loud = level > -30
f0 = 220 * (1 + 0.03 * np.sin(2 * np.pi * 5 * pv.t[m]))  # the vibrato at this moment
fig, (ax_m, ax_f) = plt.subplots(2, 1, figsize=(10, 5), sharex=True, layout="constrained")
ax_m.plot(centers, level, ".-", color="k", lw=0.6, ms=3)
ax_m.set(ylim=(-80, 3), ylabel="Magnitude [dB]", title=f"Time window at {pv.t[m]:.2f} s")
ax_f.plot(centers, centers, ":", color="k", lw=0.8, label="bin center")
for k in range(1, 5):
    ax_f.axhline(k * f0, color="tab:orange", lw=0.8, label="true partials" if k == 1 else None)
ax_f.plot(centers[loud], pv.freq[0, loud, m], "o", color="tab:blue", ms=4, label="instantaneous frequency")
ax_f.set(xlim=(0, 1000), ylim=(0, 1000), xlabel="Bin center [Hz]", ylabel="Reported frequency [Hz]")
ax_f.legend(fontsize=8, loc="upper left")
for ax in (ax_m, ax_f):
    ax.grid(ls=":")